Sine Waves on Arduino: Variation

Today Ill be building on my Arduino Sine Wave Generator project. My goal is simple, to add the ability to dynamically change the frequency of the wave being generated. I should be able to read the value from a potentiometer similar to what was used in my original Arduino PWM post and write that value into the delay variable to modify the timing.

Wiring it Up

Arduino Function Generator Wiring

The wiring for this one is pretty straight forward and nothing we haven’t seen before. On the left is a potentiometer connected between 5V and ground. The wiper of this potentiometer is connected to analog pin A0 on the Arduino. This pin will provide an input value between 0 and 1023 depending on the position of the pot.

On the right we have the digital pin 5 connected through the same low pass filter I’ve used in previous projects. This will take our PWM output and smooth it into the final waveform.

The Code

The code only needs some slight modification from my last post. We need to first define the analog pin and read its value using analogRead. This is where some choices need to be made though. I mentioned that the analogRead for the potentiometer gives us a value from 0 to 1023. If we were to write this directly to the sample_time variable we would be producing some extremely long sine waves. Since our sine table has 50 entries this would mean at the highest setting each wave would take 51.15 seconds (1023*50/1000) to complete. That might be a bit much. So we need to decide how large a range we want to use and process the input accordingly.

I chose to divide the input by 16, this gives me a frequency range from about 10Hz to 0.313Hz. In the code you’ll notice I added a hard limit at 10Hz by adding 2 to the input value. This ensures the delay time never drops below a range that the Arduino and our filter can handle.


#define PWM_PIN 5            //PWM output at pin5
#define ANALOG_0 A0          //Input for sample_time
#define PWM_FREQ  980        //Hz
#define N 50

int sine_table[50];
int sample_time;
void get_sine_table();

void setup() {
  get_sine_table();
}

void loop() {
  for (int i = 0; i < N; i++){
    sample_time = analogRead(ANALOG_0);
    sample_time = (sample_time/16)+2;
    analogWrite(PWM_PIN, sine_table[i]);
    delay(sample_time);
  }
}

void get_sine_table(){
  for (int i = 0; i < N; i++){
    sine_table[i] = 127+127*sin(i*(2*3.14)/N);
  }
}

And there you have it! We can now adjust our frequency on the fly. Sorry it’s a bit of a shorter post today life’s been pretty full of late. Still I think this marks a pretty substantial step forward in this project. In my next post I’ll be looking at implementing the ability to produce more waveforms beyond just the sine.

Filtering PWM Signals

In a recent post I talked about how you can use Pulse Width Modulation to create a simple voltage controller. However PWM is only half the story. Once we have our PWM signal how do we transform this from a malformed square wave into a nice steady DC voltage? There are many different techniques that can be used to do this but today I’d like to introduce you to one of the simplest, Low Pass Filters.

Low Pass Filters

I briefly introduced RC low pass filters in my post on Square Waves in RC Circuits. Put simply these are circuits which allow low frequency signals to pass through while attenuating high frequency signals. The reason for this has to do with the capacitors charging. If you recall from my previous post the time a capacitor takes to charge in an RC circuit is approximately equal to 5 times the time constant of the circuit (RC). When the frequency is low enough that the capacitor has the chance to fully charge and discharge each cycle the signal will pass through. If however the capacitor cannot fully charge/discharge a certain amount of the current will always be passing through the capacitor to ground which attenuates the signal at the output. The higher the frequency the greater the attenuation.

The key understanding here is what happens to the signal when it is being attenuated. You might expect if you pass a 5V square wave (0-5V) through a filter which reduces the amplitude by 50% that the resulting 2.5V signal would be from 0-2.5V. However, this is not the case. Since the capacitor cannot fully charge or discharge the signal will stabilize at the average voltage of the incoming signal. In the case of this example the signal would travel between 1.25V and 3.75V. As we attenuate it further we can get a smaller and smaller peak to peak voltage (always centered around the average voltage). The smaller these peaks, the closer you get to your target DC voltage.

Ripple Vs Stabilization Time

So that all sounds great but how do we know what capacitance and resistance to use? This actually gets a bit more complicated. When choosing our resistors and capacitors we often find ourselves balancing two undesirable characteristics of the circuit.

Consider this first filter. Obviously this is a long way from a smooth DC voltage. There is a distinct ripple in the output with the voltage moving up and down in a sharp triangle pattern. As discussed earlier we should be able to reduce this ripple by increasing the time the capacitor takes to charge (increasing the resistance or capacitance) to further attenuate the signal. This will however unfortunately introduce a new problem.

Here we can see that by increasing the attenuation of the signal we are able to produce a much smoother output signal. The issue here is on the left side of the simulation output. Since the capacitor is only charging and discharging a small amount the signal takes significantly longer to stabilize at the average voltage.

Where on this spectrum your filter falls depends largely on your application. If you need a very stable signal which will not vary over time you can use a large capacitor and/or resistance. If on the other hand your signal strength needs to change quickly over time and your circuit can handle a bit more ripple you may opt for a smaller capacitor to support this behavior.

As you might imagine there are additions we can make to this circuit to improve both of these behaviors. By adding additional complexity to this filter we can develop a more robust digital to analog converter. I hope though that this has provided something of a starting point to begin generating analog signals from your digital devices.

Square Waves In RC Circuits

Last week I introduced the Step Response in RC Circuits and we looked at a simple example of turning on a power switch. Today I’d like to extend this intuition to investigate the response of an RC circuit supplied with a square wave signal. This intuition forms the basis of understanding more complex concepts like filters and pulse width modulation.

Square Waves

We’ve used square waves quite a bit when working with simple oscillators. They are easy to understand and easy to create, but how do they relate to the step response?

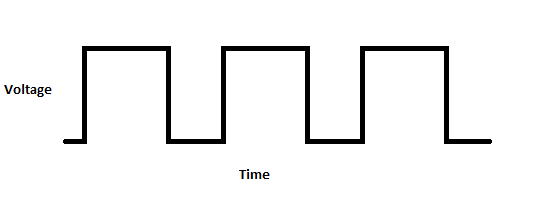
A square wave can be visualized as nothing more than a series of steps. First stepping up to the high voltage mark, then after some time stepping back down. Consider our example from last week, If instead of turning the power on and leaving it, you turned it on, waited for a period, then turned it back off. Repeating this process over and over would produce a square wave. It follows that we should be able to apply our step equation to the steps in a square wave.

A quick word about pulse width: One way square waves can be manipulated is by adjusting the “Duty Cycle.” This means changing the ratio of how long the signal is high versus how long the signal is low. To keep things simple today we will work with a 50% duty cycle meaning the signal will be high for the the same period it is low.

Frequency vs Period

When working with synthesizers you’ve probably heard signals described in terms of frequency. The frequency of a sound wave (Or any wave for that matter) is the number of times the signal cycles (goes up and back down) in a second and is expressed in Hz. For these calculations we need a slightly different descriptor for the speed of the waves. By taking the inverse of the frequency (1/f) we can find the period. The period describes the time in seconds that the wave takes to cycle. In a square wave with a 50% duty cycle we know that a step will take place twice every period (once up and once down). Further, these steps are evenly spaced. They take place at t=np and t=p(n+1/2) (Where n is any whole number).

Time Constant

Relationship Between Capacitor Charging (5V circuit) and Time Constant

In my last post I introduced the time constant. In an RC circuit the time constant is defined as the product of the resistance and capacitance (RC). It is used to determine the speed at which a capacitor will fully charge or discharge. Note the time constant is the same for both charging and discharging.

The graph above shows the relationship between the charging/discharging of a capacitor and the time constant in a 5V circuit. Since this is an exponential equation the capacitor will never fully charge or discharge (in theory) however for calculations we say that the capacitor is fully charged after 5 time steps. This charge would represent 99.3% of the maximum value. This means if you had a time constant of 0.2 the capacitor would take 1s to fully charge.

Filter Circuit

Passive Low Pass Filter Circuit

To illustrate how this all comes together lets have a look at the low pass filter circuit above. Let’s pass a square wave at 1Hz (50% duty cycle) into this circuit and see what happens. The first thing we need is our time constant for this circuit:

So if our time constant is 0.1 we know that it will take 0.5s for the capacitor to fully charge or discharge (5*0.1). With our frequency of 1Hz we know that the square wave will cycle every 1s (1/1). The steps in the square wave will occur every 0.5s (switching between stepping up and stepping down). This means every step will happen exactly when the capacitor reaches full or zero charge. So what does that look like?

Effect Of Low Pass Filter on 1Hz Square Wave

Here we can see the charging and discharging cycles have turned our square wave into a sawtooth. This is only the beginning of what filters can do for us though.

The important question here is what would happen if we changed the frequency? If we doubled the frequency to 2Hz the period would become 0.5s (1/2). This means the steps would be occurring every 0.25s instead of every 0.5s. If we bring back the equation used in my last post we can see how much voltage would build across the capacitor in this time:

Here we can see that with a frequency of 2Hz the output voltage will only reach 4.59V before the input steps back down to 0V. This attenuation only gets worse as the frequency increases. At a frequency of 4Hz the peak voltage falls to 3.57V. At 8Hz you only see a peak voltage of 0.304V.

Note: This is a slight oversimplification, since we are shortening both the high and low periods. This means not only the charging but also the discharging state will be cut short. The capacitor will be unable to fully charge or discharge so the attenuated signal will stabilize at an offset from zero volts.

It is this attenuation that makes this a low pass filter. Low frequency signals (below a certain critical point) are able to pass at full amplitude while high frequency signals are attenuated or even eliminated from the output. We’ll explore filters further at a later date but this should give you some idea of the mechanisms which allow them to function.